Fear and Greed Index Explained: How to Use Market Sentiment for Better Trades
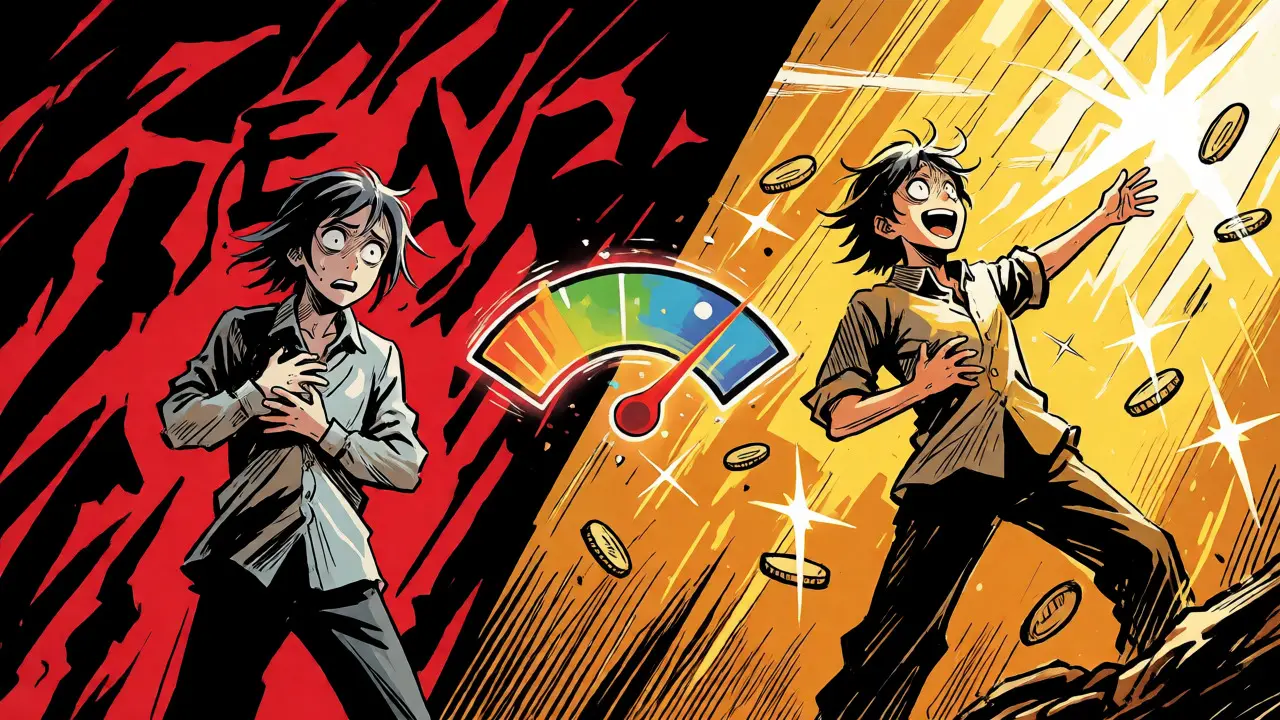
You stare at the chart. Bitcoin is dropping. Your gut screams "sell," but your brain whispers "buy." This internal conflict is exactly what the Fear and Greed Index is designed to quantify. It’s not a crystal ball, but it is one of the most widely used tools for gauging the collective emotional state of the market. Whether you are trading stocks or cryptocurrencies, understanding this indicator can help you stop reacting to noise and start acting on data.
Developed by CNN Business in 2012, this index translates complex market psychology into a single number between 0 and 100. A score near 0 means extreme fear; a score near 100 means extreme greed. The logic is simple but powerful: markets often overreact. When everyone is terrified, assets are usually cheap. When everyone is euphoric, they’re expensive. But how does it actually work? And more importantly, how do you use it without getting burned?
What Exactly Is the Fear and Greed Index?
The Fear and Greed Index is a quantitative sentiment indicator that measures investor emotions across the financial markets. Unlike fundamental analysis, which looks at earnings and revenue, or technical analysis, which looks at price patterns, sentiment analysis looks at behavior. It asks: Are people buying out of hope or panic? Are they selling out of logic or terror?
For traditional equities, the index aggregates seven distinct metrics. For cryptocurrency traders, there is a separate version created by alternative.me, which focuses on digital asset dynamics. While the methodologies differ slightly, the core purpose remains identical: to provide a snapshot of market mood. In October 2026, with algorithmic trading dominating volume, these human-centric metrics remain surprisingly relevant because algorithms often mimic human herd behavior.
The Seven Pillars of Stock Market Sentiment
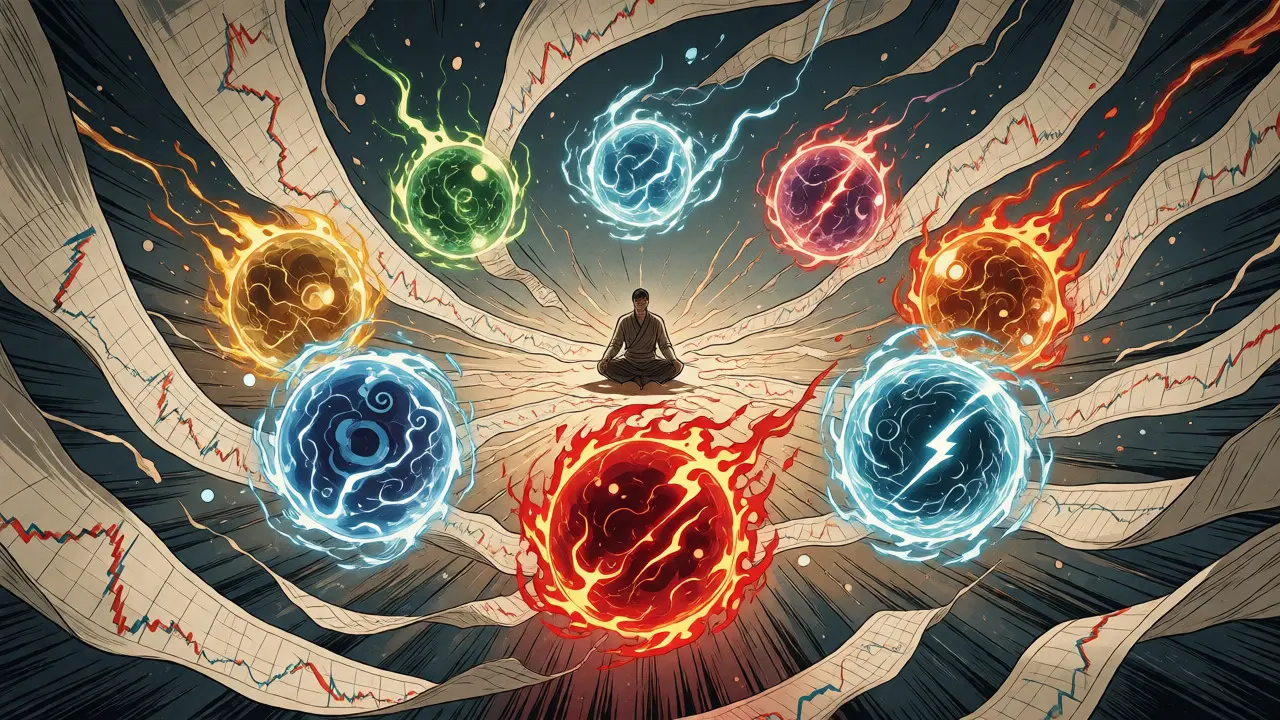
If you look at the stock market version of the index, you’ll see it’s built on an equal-weighted average of seven components. Each component is normalized to a 0-100 scale before being combined. Here is what drives the number:
- Momentum: Compares the S&P 500’s current performance against its 125-day moving average. If prices are significantly above the average, it signals greed.
- Stock Price Strength: Looks at the ratio of stocks hitting 52-week highs versus lows. More highs than lows equals greed.
- Stock Price Breadth: Measures trading volume in rising stocks versus falling stocks. High volume in gainers suggests broad-based enthusiasm.
- Put and Call Options: Analyzes the ratio of put options (bearish bets) to call options (bullish bets). Heavy put activity indicates fear.
- Junk Bond Demand: Tracks the yield spread between high-yield corporate bonds and safe Treasury bonds. Narrow spreads mean investors are willing to take risks for lower returns-greed.
- Market Volatility: Uses the Cboe Volatility Index (VIX). A high VIX means fear; a low VIX means complacency or greed.
- Safe Haven Demand: Compares stock performance against Treasury bonds. If money is fleeing stocks for bonds, fear is dominant.
Crypto Fear and Greed: A Different Beast
While the stock index relies on bond yields and option ratios, the Crypto Fear and Greed Index uses four specific metrics tailored to digital assets. Launched by alternative.me in 2018, this version acknowledges that crypto markets operate differently than traditional finance.
| Component | Stock Market Weight | Crypto Market Weight | Description |
|---|---|---|---|
| Volatility | ~14% (via VIX) | 25% | Measures current volatility compared to 30/90-day averages. |
| Momentum/Volume | ~14% (via Breadth) | 25% | Current volume and momentum compared to historical averages. |
| Social Media | N/A | 15% | Scrapes Twitter/X and Reddit for keyword frequency and engagement. |
| Dominance | N/A | 10% | Tracks Bitcoin's share of the total crypto market cap. |
| Surveys/Trends | ~70% (Other factors) | 25% | Google Trends and other proprietary data points. |
The inclusion of social media sentiment is crucial for crypto. In 2021 and 2022, viral tweets moved markets faster than any balance sheet could justify. By monitoring keywords like "moon," "crash," or "adoption," the crypto index captures the hype cycle in real-time.
How to Read the Scale: What Do the Numbers Mean?
Interpreting the index requires context, not just memorization. However, general guidelines exist:
- 0-24 (Extreme Fear): Investors are panicking. Assets may be undervalued. Contrarians often buy here.
- 25-49 (Fear): Negative sentiment dominates, but panic hasn't peaked. Caution is advised.
- 50 (Neutral): No strong emotion. The market is balanced.
- 51-74 (Greed): Optimism is growing. Prices may be rising due to FOMO (fear of missing out).
- 75-100 (Extreme Greed): Euphoria has set in. Markets are likely overbought. Risk of correction increases.
Remember the famous quote attributed to Warren Buffett: "Be fearful when others are greedy, and greedy when others are fearful." The index helps you identify those moments objectively.
Common Mistakes Retail Traders Make
Just because the index says "Extreme Fear" doesn't mean you should hit the buy button immediately. Many beginners treat it as a precise timing tool, which leads to losses. Here are three pitfalls to avoid:
- Treating it as a standalone signal: The index tells you how people feel, not what will happen next. A market can stay irrational longer than you can stay solvent. Always combine sentiment with technical support levels or fundamental valuation.
- Ignoring the trend: In a strong bull run, the index can stay in "Extreme Greed" for weeks. Selling every time it hits 80 might cause you to miss significant gains. Conversely, during a crash, it can stay in "Extreme Fear" for months.
- Overreacting to daily fluctuations: The index updates daily, but sentiment shifts slowly. Don’t change your entire portfolio strategy based on a single day’s reading. Look for sustained trends over weeks.
Real-World Examples: When Sentiment Saved Portfolios
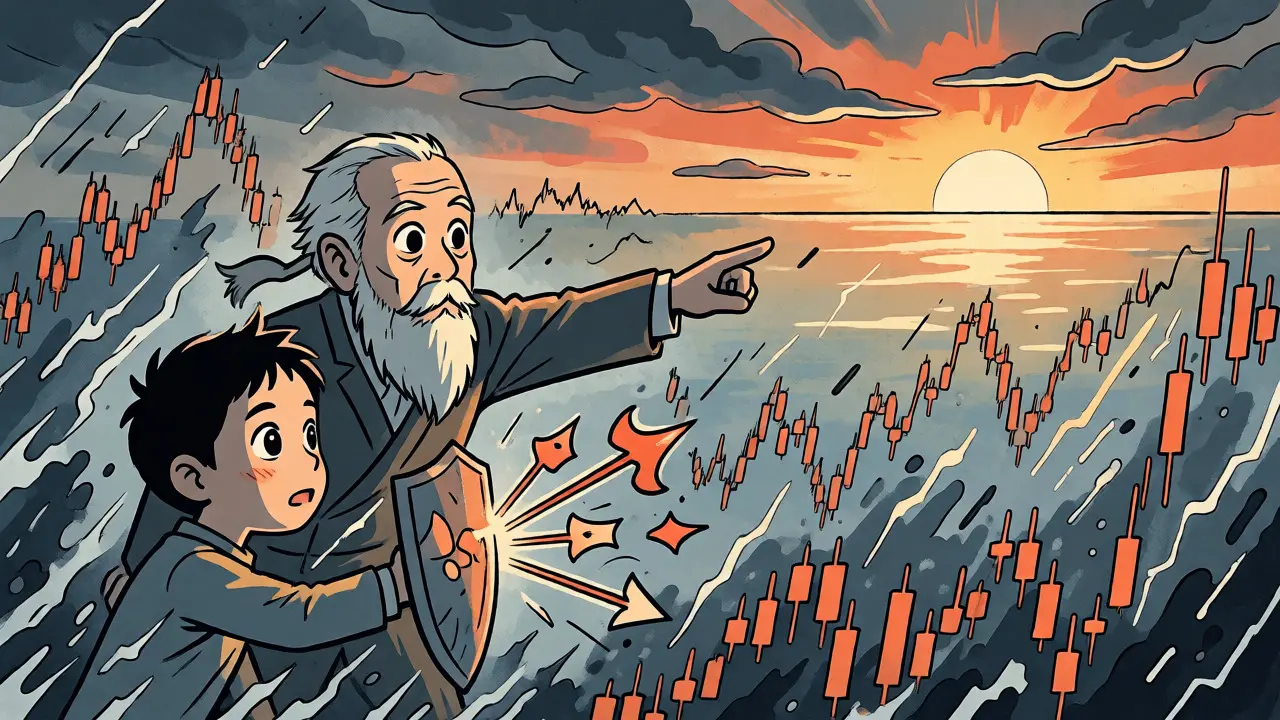
History shows the index works best as a contrarian indicator. Consider March 2020. As the pandemic hit, the stock market Fear and Greed Index plummeted to 2-the lowest level ever recorded. Most retail investors sold in panic. Those who bought aggressively at that extreme fear level saw massive returns as the market rebounded within six months.
In the crypto world, January 2021 saw the Crypto Fear and Greed Index hit 90+. Bitcoin was surging, and everyone was talking about $100k BTC. Experienced traders viewed this extreme greed as a warning sign. They began taking profits. Six months later, the market corrected sharply. While no one sells perfectly at the top, using the index helped many lock in gains before the drop.
Practical Strategy: How to Use It Daily
So, how do you integrate this into your routine? You don’t need to trade every day. Instead, use the index as a filter for deeper analysis.
- When the index is below 25: Ask yourself, "Is this asset fundamentally sound?" If yes, consider accumulating. This is a potential buying opportunity.
- When the index is above 75: Ask yourself, "Am I holding too much risk?" Consider trimming positions or setting tighter stop-losses.
- When the index is neutral (40-60): Focus on technical setups. Sentiment isn’t driving the market, so look for breakouts or breakdowns on charts.
A good rule of thumb from behavioral finance experts is to wait for a reversal signal. Don’t buy just because fear is high; wait for the fear to start decreasing while price stabilizes. That divergence often marks the true bottom.
The Future of Sentiment Analysis
The landscape is changing. CNN Business has experimented with adding social media data to their stock index, recognizing that online chatter now moves markets faster than news releases. Meanwhile, AI-driven sentiment tools are becoming more sophisticated, parsing not just volume but tone and context.
However, the core limitation remains: sentiment reflects the past and present, not the future. It cannot predict black swan events or sudden regulatory changes. As algorithmic trading grows, some argue the index’s effectiveness may diminish as bots exploit these very signals. Yet, as long as humans drive the underlying liquidity, emotional extremes will continue to create opportunities for disciplined investors.
Is the Fear and Greed Index accurate?
It is accurate in measuring current sentiment, but it is not a predictive tool. Historical data shows it identifies extremes well, but it cannot predict the exact timing of market reversals. It works best as a secondary confirmation tool alongside technical and fundamental analysis.
Can I use the stock market index for crypto?
Not directly. While correlated, crypto markets have unique drivers like halving cycles and regulatory news. Use the dedicated Crypto Fear and Greed Index for digital assets, as it accounts for volatility and social media hype specific to blockchain technology.
What is a good Fear and Greed score for buying?
Generally, scores below 25 (Extreme Fear) indicate potential buying opportunities for value investors. However, you should verify that the asset’s fundamentals haven’t deteriorated permanently. Buying at 20 is better than buying at 80, provided the thesis holds.
Does the index update in real-time?
No, it updates once per day, typically after market close. It provides a daily snapshot rather than a live feed. This prevents intraday noise from triggering unnecessary trades.
Why is my crypto index different from another site?
Different providers use different weightings and data sources. Alternative.me focuses heavily on volatility and social media, while other platforms might prioritize exchange inflows/outflows. Always check the methodology behind the specific index you are using.